
TRANSPORTATION IMPACT FEES – Documenting GRAFT
Traffic counts in El Dorado County are down significantly over the past few years. Traffic counts determine traffic impact fees because they track the level of use on the roads. Traffic counts are the most important documentation of road usage. Traffic counts must be used to validate the county’s traffic model. So, when counts decrease and the model forecast increased traffic then something is wrong with the model. Traffic congestion has decreased to levels below when impact fees were passed. As a consequence, the legality of mitigation fees is in question. Most local roads have 5 years of declining trip counts. Many of those traffic counts drop below 2003 levels (El Dorado County Traffic counts). Mitigation fee laws require studies and findings that justify the need for fees and the traffic model is the mechanism used to manipulate the data. .
At issue is the forecasting for the massive need for costly infrastructure we are building in El Dorado County. Erroneous forecasting resulted in high mitigation fees now, which are now being charged. However, the county’s failure to act on required fee updates and decreased auto trip count data has allowed the fees to remain high and continue at high rates. We detail these issues below and label them as abuse instances.
The Growth Rate Manipulation
El Dorado County Supervisors ascribed a 1.03% growth rate for all transportation zones. However, El Dorado Hills Transportation Zone 8 shows growth rates 10 times greater than some outlying transportation zones allowing other zones to pay for El Dorado Hills zone 8’s impacts. This is a violation of the nexus requirements and provides preference to zone 8 fee payers (reduced fees). See the maps! They include growth charts for each zone in the lower right corner. Maps were provided by the EDC Surveyors Office.
The 5-Year Update Instance (LITIGATION UPDATE – the county has lost big-time)
The government code requires a 5-year update and annual review with a public hearing so fees may be validated or protested. The government code indicates fees should be returned if the 5-year update is not performed. The County Department of Transportation (DOT) was over FIVE years behind in producing a 5-year update. No effort has been made by DOT to refund the fees. However, a lawsuit was filed Austin V El Dorado County and a tentative ruling was published. The Mountain Democrat published the news on 11/8/17 and the decision means impact fees will likely be returned to roughly 10,000 properties. The plaintiff estimates $30,000,000 in fees will be returned to citizens. Two other lawsuits have been filed with Friends of El Dorado County as a co-plaintiff in one of the suits. Our Sheetz lawsuit has prevailed at the US Supreme Court which will change forever the way fees are collected. The Austin case has also prevailed with refunds coming soon.
The Trip Count Instance
The trip counts are declining over the long term and forecasting positive trips is near impossible from a negative statistical trend-line. DOT is forced to wait for a statistical trend to turn positive. However, trips have continued to decrease and the failure to account for those declines becomes a compounding problem for the county. Failure to process the required 5-year update, and trip count declines, allows for the exploitation of residents paying impact fees. DOT’s declining traffic counts are on their web site under Traffic Counts.
There is consideration for the dramatic changes happening to our workforce. “Work at Homers” now constitute over 25% of El Dorado County’s workforce. Retirees are prevalent in El Dorado County and they are generally not commuters. We use an old Census Transportation Planning Package (CTPP) to determine the work at home residents is rapidly growing. The change in employment characteristics is reducing our need for transportation infrastructure and it is evidenced in trip counts.
Trip Count Instance HWY 50
The El Dorado County Department of Transportation is charging impact fees on Highway 50, although on-ramp and off-ramp counts indicate total trips are down about 12,000 ticks a day below 2003 levels (2015 ramp counts -‐ Cal Trans). The ramp counts, which are completed every three years by Cal Trans, demonstrate Highway 50’s congestion is abating as transportation impact fees were increasing. We document Cal Trans trip counts on the HWY 50 ramps to show local traffic impacts to HWY 50 decreased.
The New Traffic NEXUS – THE MISSING RESIDENTIAL UNITS
Transportation Impact Fees (TIM Fees) are justified by the county making findings about the need for infrastructure which for the most part is determined by GROWTH in residential units. When we examine the count of residential units built in each traffic zone we find about 4,000 missing units in the NEXUS STUDY (pg 170). The nexus study quote below relates the importance of the historical growth.
The missing units are from El Dorado Hills TIM ZONE 8. We document historical growth in residential units in all TIM zones using Census reports filed monthly by the county. Counts are in error in the Nexus study – Exhibit D Appendix A and growth charts
The Saratoga and Green Valley Instance – THE PLAN FOR CONGESTION – Congestion = FED GRANTS and HIGH FEES
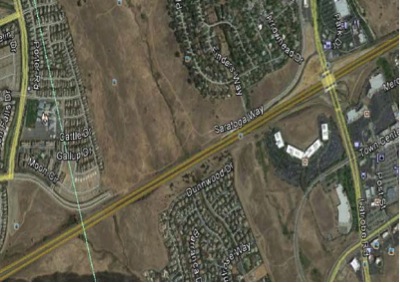
Saratoga, a parallel capacity 4-lane divided parkway took longer to complete than the Loma Prieta, the Bay Bridge, and I-5’s earthquake repairs. The project needed less than a half mile of paving! Saratoga is parallell capacity to HWY 50 and is a critical to health and safety projects, like connecting residents to hospitals.
The county has failed to deliver critical projects in a timely manner, and instead protracted projects that would have substantially reduced congestion on Highway 50. The greatest concern we present is DOT’s 19-year delay in advancing congestion relieving projects. The delays in completion of Green Valley and Saratoga in the 1990’s are documented in county records. According to county documents, funds were redirected to Latrobe Road to benefit development south of Highway 50 (BOS Agenda – 1/17/1995).
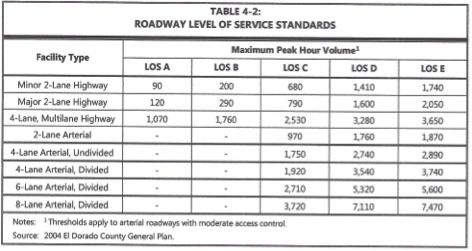
In 2005, county auditor Joe Harn wrote to the DOT about the failure to complete Saratoga and the importance of the project (attached email and response from DOT Director and 2005 Sac Bee article). According to El Dorado County’s general plan Level of Service (LOS) standards, Saratoga would carry about 2,000 cars per hour at LOS “C” and 3,500 at LOS “D” or about half of HWY 50’s congestion. Saratoga and Green Valley Roads were removed from the project list in 1995 (BOS Agenda – 1/17/1995). Saratoga would have provided substantial relief at the El Dorado Hills Interchange, had it been completed before the overpass work. The capacity relief that Saratoga would provide for HWY 50 is seen in the General Plan LOS Chart below.
Saratoga would provide a direct connection to Iron Point Road to Intel, Costco, and commercial shopping. About 2/3 of traffic going west on Highway 50 dissipates in Folsom and Rancho Cordova (SACOG 2008) emphasizing the importance of Saratoga.
We believe Saratoga was stalled for 20 years to keep congestion on Highway 50. We believe this was done to keep fees high and transportation grants coming in. See the January 17, 1995 BOS minutes insisting on accelerating the improvement of Latrobe Rd.
According to county documents, the paving length for completion is less than some drive ways. So read here what does a maid service include? It is about 2,400 feet to complete the road connection. Saratoga is the cheapest and easiest project in our capital improvement plan that would dramatically improve Highway 50’s congestion and onramp access.
Other more expensive projects have gone forward (MF/ Diamond Springs Parkway, HOV lanes, Ray Lawyer Dr overpass, and Silva Valley Interchange). These expensive projects provide marginal congestion relief for Highway 50 . (See the Cal Trans study on HOV lanes.)
We believe the failure to complete Saratoga is a 16-year violation of Measure Y’s concurrency requirements with NO help from the Measure “Y” committee members. El Dorado County’s Department of Transportation needs congestion to acquire grants and keep the fees high.
Finally, please look at the attachments for the Saratoga and Highway 50 trip count documentation.
Click Here for the pdf version of this information
Click Here for the 2010 Census Transportation Planning Package
Click Here for the 2015 Census Transportation Planning Package
Click Here for the 2013 5-Year Traffic Count Summary
Click Here for Joe Harn’s E-mail to the Director of DOT, which was referenced above
Click Here for Richard Shepard’s (Director of El Dorado County’s Transportation Department) E-mail to Joe Harn regarding Saratoga
Click Here for 2003 to 2012 Highway 50 Ramp Counts